Processing
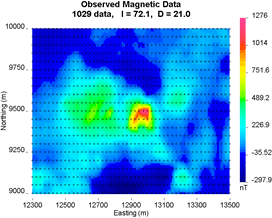
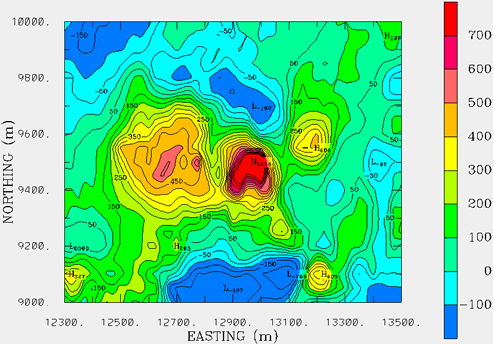
Preparation of magnetic field data prior to inversion involves several steps. Locations of individual data points are shown in Fig. 2 and a processed image is shown in Fig. 3.
- Most magnetics data sets need to be reduced to an anomaly map rather than working with raw, total magnetic field strength. For the Mt. Milligan data set, this was done by subtracting a reference field derived from the large scale airborne data set.
- In addition, the large data set was decimated to avoid having more than the necessary number of data points needed for the model cell sizes chosen. In this case, data were down-sampled to 25 metre intervals along survey lines, which were 50 metres apart. A total of 1029 data points were used in the inversion.
- The resulting data set was also upward continued to 20 metres in order to suppress anomalies caused by features smaller than a single cell.
- Data errors must also be assessed, and in this case, 5% plus 10 nT for each datum was deemed appropriate.


